Optimize ASP.NET Core memory with DATAS

.NET 8 introduces a new Garbage Collector feature called DATAS for Server GC mode - let's make some benchmarks and check how it fits into the big picture.

In diesem Artikel:

kp_300x300
Kenny Pflug ist Consultant bei Thinktecture und spezialisiert auf Architektur und Design von verteilten Systemen mit ASP.NET Core.

TL;DR

Maoni Stephens, one of the lead architects of the .NET Garbage Collector (GC), recently published a blog post about a new .NET GC feature called Dynamic Adaption To Application Sizes (DATAS) which will come with .NET 8. This feature will automatically increase or decrease the number of managed heaps in Server GC mode during app runtime. It decreases the total amount of memory used by your .NET app (in my tests, about 8 times on an AMD 16 core processor with Simultaneous Multithreading enabled), making Server GC mode a viable option for memory-constrained environments like Docker containers or Kubernetes pods which have access to several logical CPU cores.

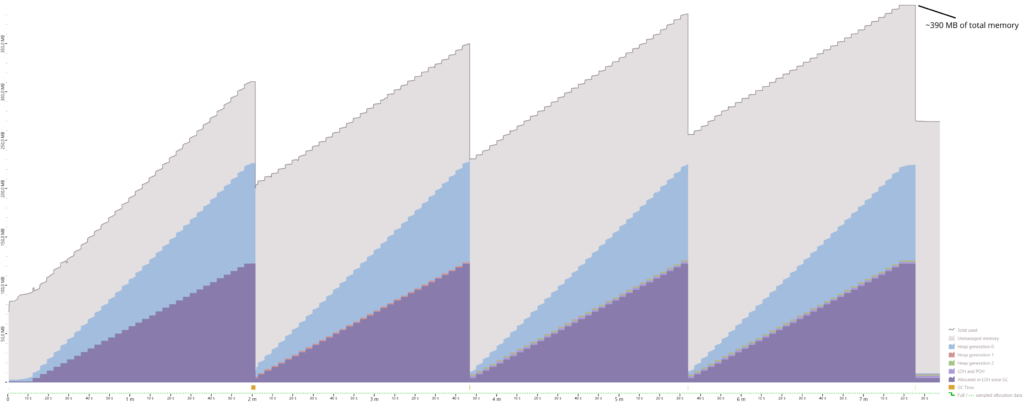
Let's start with a benchmark

When you run an ASP.NET Core application on .NET 7, put some stress on it by allocating objects, and track the Garbage Collector (GC) metrics, you might see something like this:
.NET 7 Server GC run
In the picture above, you can see that we start out at around 80MB of total memory, most of it being attributed to the .NET CLR (gray area in the diagram representing unmanaged memory). The managed heap is nearly empty, because our application just started. Once we call endpoints, objects get allocated in generation 0 of the Small Object Heap (SOH, blue area), and after a 1000 endpoint calls, we also allocated objects greater than 85,000 bytes in size which will be placed on the Large Object Heap (LOH, violet area). We allocate more memory and around the two minute mark, the first full compacting GC run occurs. Objects that survive in the SOH will be placed in generation 1 (thin red area), while the LOH/POH is simply freed. We then continue allocating and can identify that the next full compacting GC runs occur at 3:46, 5:32, and 7:25 minutes, respectively. The red area and green area (generation 1 and generation 2 of the SOH) stay pretty small because most of our objects are transient.
During the benchmark run, we used up to 390 MB of memory (including unmanaged memory). We could get away with less memory by enabling workstation mode (I’ll show you further down in the article how you can do that). The resulting graph might look something like this:
.NET 7 Workstation GC
The first thing you should notice is the vastly different amount of memory used. We only use ~36MB of memory at max. After 1:40 minutes, total memory consumption stays stable at around 30 MB. We can also see there are a lot more jagged edges of generation 0 (blue area), indicating that compacting GC is run more often than in Server GC mode. But why is that?

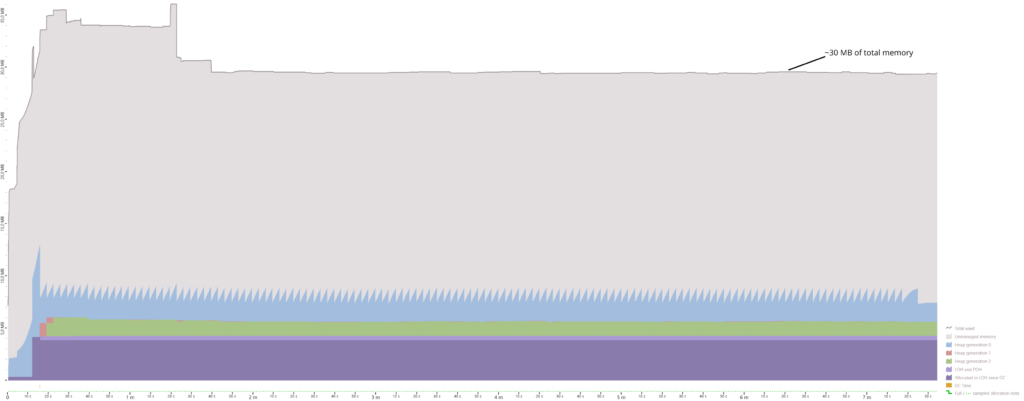
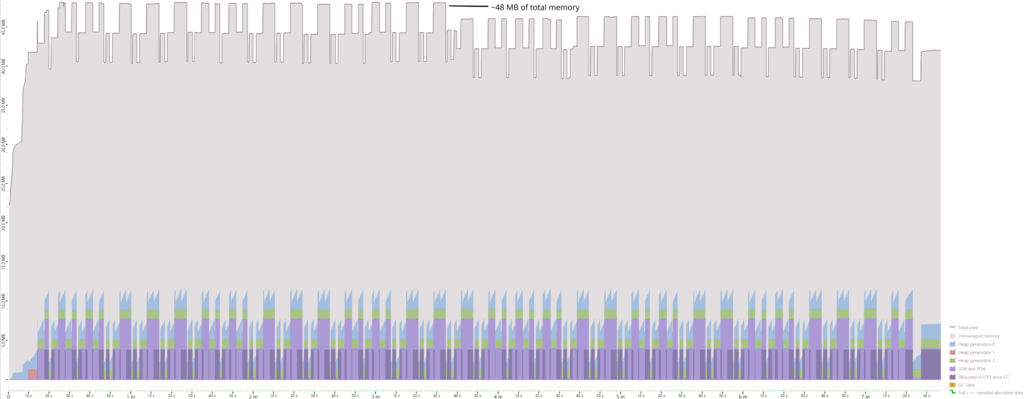
Differences between Server GC mode and Workstation GC mode

The Workstation mode was originally designed for client applications. Back in the day, the threads executing app code were halted until a GC run was finished. In desktop apps, you do not want to introduce freezes for several milliseconds or even seconds, thus the Workstation GC was tuned to perform runs more frequently and to finish individual runs faster. Since .NET Framework 4.0, we also have background GC runs which minimize the time threads are blocked.
Server GC in contrast was designed for maximizing throughput for services which will receive short-lived requests over time. GC runs happen less frequently but may take longer. In the end, you will spend less time on GC runs and more time in your service code.
The most glaring difference is the following: Workstation GC only uses a single managed heap. A managed heap consists of the following sub-heaps:
  • the Small Object Heap (SOH) with its three generations 0, 1, and 2. Objects smaller than 85,000 bytes are allocated here.
  • The Large Object Heap (LOH) which is used for objects greater than or equal to 85,000 bytes.
  • The Pinned Object Heap (POH) which is mostly used by libraries that perform interop and pin buffers for that (e.g. for networking or other I/O scenarios).
In Server GC mode, you will have several of these managed heaps, by default one per logical CPU core, but this can be tuned via GCHeapCount.
The additional number of managed heaps, as well as the fact the GC runs are performed less often, are the important factors explaining why memory consumption is much higher in Server GC mode.
But what if you want to benefit from Server GC mode while also dynamically adjusting the number of managed heaps during runtime? A typical scenario would be a service that runs in the cloud and that must handle a lot of requests at certain burst times, but afterwards it should scale down to reduce memory consumption. Up until now, there was no way for you to achieve that except with restarting the service with different configuration values. Scaling up would also require a restart – thus many dev teams just tried to find a compromise via the GCHeapCount and ConserveMemory options.

And then along comes DATAS

This is where a new feature called Dynamic Adaption To Application Sizes (DATAS) comes into play. It will be available with .NET 8 and you can already try it out in the since preview 7 or in the current RC1. The results of the same benchmark with DATAS enabled look like this:
The important thing to note here: although we are running in Server GC mode, our process only used 48 MB of total memory at maximum with DATAS activated (you cannot use it in Workstation mode). GC runs occur more often than in the first diagram, we can see a ramp up in the beginning and a ramp down at the 3:40 mark, indicating a change in the number of managed heaps. In the end, this is approximately eight times less than the 390 MB of total memory in Server GC mode in .NET 7.
DATAS will operate in the following way during runtime:
  1. The GC will start with only a single managed heap.
  2. Based on a metric called “throughput cost percentage”, the GC will decide whether it is viable to increase the number of managed heaps. This will be evaluated on every third GC run.
  3. There is also a metric called “space cost” which the GC uses to decide whether the number of managed heaps should be reduced.
  4. If the GC decides to increase or decrease the number of managed heaps, it will block your threads (similarly to a compacting GC run) and create or remove the managed heap(s). Corresponding memory regions will be moved. The switch from segments to regions in .NET 6 and .NET 7 when it comes to the internal organization of memory within a managed heap makes this scenario possible to implement.
By the way: DATAS will not be available for .NET Framework 4.x, only for .NET 8 or later.

Benefits and drawbacks?

DATAS will allow you to use Server GC mode in memory-constraint environments, for example in Docker containers, Kubernetes pods, or App Service in Azure. During bursts where your service will be hit with a lot of requests, the GC will dynamically increase the number of managed heaps to benefit from the optimized throughput settings of Server GC. When the burst is over, the GC will reduce the number of managed heaps again, thus reducing the total amount of memory used by your app. Even during bursts, the GC might choose to increase the  managed heaps to a number less than one per logical CPU core, so you might end up with your app using less memory in total, without you having to configure the number of managed heaps manually.
Please keep in mind: when your app only has a single logical CPU core available, you should always use Workstation GC mode. Server GC mode is only beneficial when your app has two or more cores available. Also, I would recommend to verify that you actually require Server GC mode. Use tools like K6 or NBomber to measure the throughput of your web app. If you designed the memory usage of your app carefully, you might see no difference in throughput at all. Always remember: the .NET GC will only perform its runs when you allocate memory.

How to try it out

To try out DATAS, you need to install the .NET 8 SDK, at least preview 7, create a .NET 8 app (e.g. ASP.NET Core) and then you can add the following two lines to your .csproj file:
				
					
<PropertyGroup>
    <ServerGarbageCollection>true</ServerGarbageCollection>
    <GarbageCollectionAdaptationMode>1</GarbageCollectionAdaptationMode>
</PropertyGroup>


You can also specify it via command-line arguments when building your project:

				
					dotnet build /p:ServerGarbageCollection=true /p:GarbageCollectionAdaptationMode=1


Or in runtimeconfig.json:

				
					"configProperties": {
    "System.GC.Server": true,
    "System.GC.DynamicAdaptationMode": 1
}


Or via environment variables:

				
					set DOTNET_gcServer=1
set DOTNET_GCDynamicAdaptationMode=1
				
			
Please keep in mind: you must not set the GCHeapCount option when using one of the methods above. If you do, the GC will just use the specified number of heaps and not activate DATAS.
Also important: if you want to run in Workstation mode, simply set ServerGarbageCollection or the corresponding config property/environment variable to false or zero, respectively.
But this leaves one question: what if you do not specify any of these options?

Which GC mode will my ASP.NET Core app use by default?

You can substitute this question with another question: how many logical CPU cores can your ASP.NET Core app access? If it is less than two, then it will use Workstation GC mode. Otherwise, Server GC mode will be activated by default. So be particularly careful when you specify the constraints for your app in Docker, Kubernetes or Cloud environments where you might suddenly end up in another GC mode taking up more memory than expected.
 

Discussion, Conclusion, and Outlook

In my opinion, DATAS is a great new feature which brings the benefits of Workstation GC and Server GC together: you start out with less memory and when a burst of requests comes in, the GC can dynamically scale its number of managed heaps up to improve throughput. When the number of requests decreases at some later point in time, the number of managed heaps can be decreased, too, to free up memory.

But also, the devil is in the details: when tracing ETW events with PerfView, the reported number of heaps in my benchmarks was always 1 – I will take a look at the official ASP.NET Core benchmarks to see how they traced the exact number of managed heaps. Another important aspect is the decision whether a scale up or scale down is performed: this happens on every third run of the GC, and normally a GC run is only triggered when memory is allocated and the allocation contexts of the threads do not have enough memory left. What if suddenly no allocations are performed (because no requests are incoming)? Will the number of heaps not decrease? And finally, we saw interesting behavior when it comes to the amount of GC runs with DATAS enabled: we could see that they were triggered significantly more often than in regular Server mode – how exactly do the number of GC runs relate to the number of managed heaps?

In the end, DATAS will probably be handled in a similar way to the regions feature: it was introduced in .NET 6, but only activated by default in .NET 7. I would expect that in .NET 8, you have to manually opt in to this feature, while in .NET 9, it might be on by default. We will see what the time brings.


Appendix: About the benchmarks

The code that was used to produce the graphs above is a simple ASP.NET Core Minimal API with a single endpoint, which looks like this:
				
					using System.Threading;
using Microsoft.AspNetCore.Builder;
using Microsoft.AspNetCore.Http;

namespace WebApp;

public static class Endpoint
{
    private static ulong _numberOfCalls;
    private static int[]? _currentArray;

    public static void MapEndpoint(this WebApplication app)
    {
        app.MapGet(
            "/api/call",
            () =>
            {
                var numberOfCalls = Interlocked.Increment(ref _numberOfCalls);
                if (numberOfCalls != 0 && numberOfCalls % 1000 == 0)
                {
                    var largeArray = new int[30_000];
                    Interlocked.Exchange(ref _currentArray, largeArray);
                }

                return Results.Ok(new NumberOfCallsDto(numberOfCalls));
            }
        );
    }
}

public sealed record NumberOfCallsDto(ulong NumberOfCalls);
				
			
When the endpoint is called, the _numberOfCalls static field is incremented by using the lock-free Interlocked.Increment method to avoid concurrency issues (several requests hitting the endpoint at once). Every 1000th call, a new large array is allocated in the LOH and the reference to the previous array is exchanged with the new one (see violet area in the diagrams). Also, every call allocates a single NumberOfCallsDto on the SOH (blue, red, and green areas in the diagram). Of course, there is additional overhead of everything that ASP.NET Core allocates for an HTTP request, like a DI container scope, the HttpContext instance and all objects that it references, etc.
This endpoint is then called via NBomber, a load testing tool for .NET. The client looks like this:
				
					using System;
using System.Net.Http;
using NBomber.CSharp;
using NBomber.Http.CSharp;

namespace BomberClient;

public static class Program
{
    public static void Main()
    {
        const int numberOfCallsPerInterval = 300;
        var interval = TimeSpan.FromSeconds(1);

        using var httpClient = new HttpClient();
        var scenario =
            Scenario
               .Create(
                    "bomb_web_app",
                    async _ =>
                    {
                        var request = Http.CreateRequest("GET", "http://localhost:5000/api/call");

                        // ReSharper disable once AccessToDisposedClosure
                        // HttpClient will not be disposed when this lambda is called
                        return await Http.Send(httpClient, request);
                    })
               .WithoutWarmUp()
               .WithLoadSimulations(
                    Simulation.RampingInject(numberOfCallsPerInterval, interval, TimeSpan.FromSeconds(20)),
                    Simulation.Inject(numberOfCallsPerInterval, interval, TimeSpan.FromMinutes(7)),
                    Simulation.RampingInject(0, interval, TimeSpan.FromSeconds(10))
                );

        NBomberRunner.RegisterScenarios(scenario).Run();
    }
}
				
			
Here, we instantiate a scenario which will ramp up to 300 calls per second in 20 seconds, then stays at this rate for 7 minutes, and then ramps down to zero calls per second within 10 seconds. Requests are sent to the endpoint using the NBomber.Http package.
The source code for this post can be found here.
The tests were executed on the following machine:
  • AMD Ryzen 9 5950X, 1 CPU, 32 logical and 16 physical cores
  • 64 GB DDR4-3400 RAM Dual Channel 16-16-16-36
  • Windows 11 Pro 22621.2134
Performance data was captured with JetBrains dotMemory 2023.2.1 and Perfview 3.1.5.
Kostenloser
Newsletter

Aktuelle Artikel, Screencasts, Webinare und Interviews unserer Experten für Sie

Verpassen Sie keine Inhalte zu Angular, .NET Core, Blazor, Azure und Kubernetes und melden Sie sich zu unserem kostenlosen monatlichen Dev-Newsletter an.

Newsletter Anmeldung
Diese Artikel könnten Sie interessieren
.NET
pg

Pattern Matching with Discriminated Unions in .NET

Traditional C# pattern matching with switch statements and if/else chains is error-prone and doesn't guarantee exhaustive handling of all cases. When you add new types or states, it's easy to miss updating conditional logic, leading to runtime bugs. The library Thinktecture.Runtime.Extensions solves this with built-in Switch and Map methods for discriminated unions that enforce compile-time exhaustiveness checking.
26.08.2025
.NET
pg

Value Objects in .NET: Integration with Frameworks and Libraries

Value Objects in .NET provide a structured way to improve consistency and maintainability in domain modeling. This article examines their integration with popular frameworks and libraries, highlighting best practices for seamless implementation. From working with Entity Framework to leveraging their advantages in ASP.NET, we explore how Value Objects can be effectively incorporated into various architectures. By understanding their role in framework integration, developers can optimize data handling and enhance code clarity without unnecessary complexity.
12.08.2025
.NET
pg

Smart Enums: Adding Domain Logic to Enumerations in .NET

This article builds upon the introduction of Smart Enums by exploring their powerful capability to encapsulate behavior, a significant limitation of traditional C# enums. We delve into how Thinktecture.Runtime.Extensions enables embedding domain-specific logic directly within Smart Enum definitions. This co-location of data and behavior promotes more cohesive, object-oriented, and maintainable code, moving beyond scattered switch statements and extension methods. Discover techniques to make your enumerations truly "smart" by integrating behavior directly where it belongs.
29.07.2025
.NET
pg

Discriminated Unions: Representation of Alternative Types in .NET

Representing values that may take on multiple distinct types or states is a common challenge in C#. Traditional approaches—like tuples, generics, or exceptions—often lead to clumsy and error-prone code. Discriminated unions address these issues by enabling clear, type-safe modeling of “one-of” alternatives. This article examines pitfalls of conventional patterns and introduces discriminated unions with the Thinktecture.Runtime.Extensions library, demonstrating how they enhance code safety, prevent invalid states, and improve maintainability—unlocking powerful domain modeling in .NET with minimal boilerplate.
15.07.2025
.NET
pg

Handling Complexity: Introducing Complex Value Objects in .NET

While simple value objects wrap single primitives, many domain concepts involve multiple related properties (e.g., a date range's start and end). This article introduces Complex Value Objects in .NET, which group these properties into a cohesive unit. This ensures internal consistency, centralizes validation, and encapsulates behavior. Discover how to implement these for clearer, safer code using the library Thinktecture.Runtime.Extensions, which minimizes boilerplate when handling such related data.
01.07.2025
.NET
pg

Smart Enums: Beyond Traditional Enumerations in .NET

Traditional C# enums often fall short when needing to associate data or behavior with constants, or ensure strong type safety. This article explores the "Smart Enum" pattern as a superior alternative. Leveraging the library Thinktecture.Runtime.Extensions and Roslyn Source Generators, developers can easily implement Smart Enums. These provide a robust, flexible, and type-safe way to represent fixed sets of related options, encapsulating both data and behavior directly within the Smart Enum. This results in more maintainable, expressive, and resilient C# code, overcoming the limitations of basic enums.
17.06.2025