
This blog post is not a deep dive into the world of execution plans but a motivation to start how to read them. An execution plan is a powerful tool that can give you useful insights into the internals of query execution. If you need another example to see what execution plans are good for, I recommend reading my previous blog post about fuzzy searches.
What is an execution plan?
An execution plan is a textual representation, i.e. a description, of all operations the database does in order to fulfill a database request. An operation could be a JOIN, filtering, projection, sorting, or other. Depending on the database, we can get even more information such as the indices used, the amount of data flowing from operation to operation, and the costs of an operation, just to name a few.
Please note: this blog post is not about the particular LINQ queries I am using here but to show you how much information an execution plan can provide us with!
In this scenario, I am using Entity Framework Core 3.1 and MS SQL Server. The examples below are working on two tables containing Products and ProductGroups, but this time we have another index on Products:
					CREATE NONCLUSTERED INDEX IX_Products_GroupId ON Products
(
    GroupId ASC,
    Id ASC
)
INCLUDE( Name )
Comparing two LINQ queries
When working with Entity Framework Core (EF) we mostly write LINQ queries. So let’s start with a comparison of two simple but fancy queries. Both produce the same result.
					// query 1
var groups = ctx.ProductGroups
                .Select(g => new
                             {
                                 g.Products.FirstOrDefault().Id,
                                 g.Products.FirstOrDefault().Name
                             })
                .ToList();

// query 2
var groups = ctx.ProductGroups
                .Select(g => g.Products
                              .Select(p => new
                                           {
                                               p.Id,
                                               p.Name
                                           })
                              .FirstOrDefault())
                .ToList();
The first query uses FirstOrDefault() before selecting the required columns. The second query does the same but in reverse order.
When looking at the two queries for the first time, I could not even guess which of them would perform better. Furthermore, EF could optimize one of them or both, so in the end, the same SQL statement could be executed for both. This leads us to a comparison of the SQL statements generated by EF.
Comparing two SQL statements
With a profiling tool for the database or alternatively, by proper configuration of the logging of EF, we are able to get to the SQL statements.
The queries are slightly modified for the sake of readability.
					-- query 1
SELECT
 ( SELECT TOP(1)   Id FROM Products p WHERE g.Id = p.GroupId ) AS Id,
 ( SELECT TOP(1) Name FROM Products p WHERE g.Id = p.GroupId ) AS Name
FROM ProductGroups g

-- query 2
SELECT p.Id, p.Name
FROM ProductGroups AS g
LEFT JOIN
(
    SELECT *
    FROM
    (
        SELECT *, ROW_NUMBER() OVER(PARTITION BY GroupId ORDER BY Id) AS row
        FROM Products
    ) AS p
    WHERE p.row <= 1
) AS p ON g.Id = p.GroupId
Reading execution plans
Until now, neither reading LINQ nor the SQL queries gave us any real clues. Let’s compare the execution plans without diving in too deep.
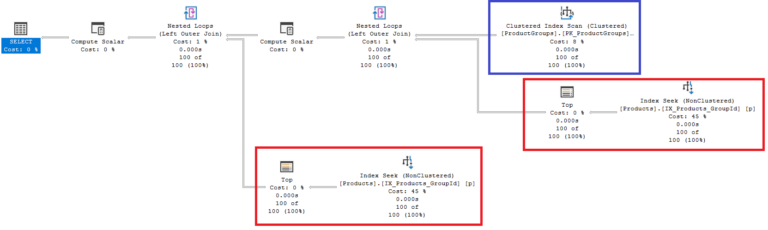
Execution plan of the first query
The execution plan of the first query consists of three main parts:
- 1 table access for fetching all
ProductGroups(in blue). To be more precise, the database scans the clustered index record by record. - 2 table accesses for fetching the first
Productof eachProductGroup(in red). The database uses the index (seek)IX_Products_GroupIdto jump to the first product.
In the end, the three data sources are JOINed together using LEFT OUTER JOIN although the actual SQL statement has no JOINs at all.
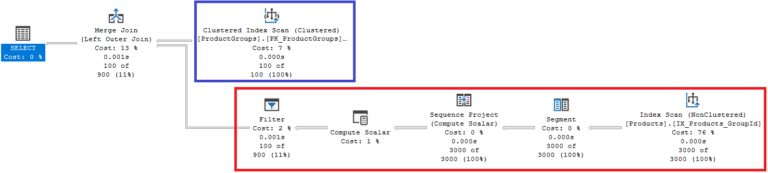
Execution plan of the second query
The second query has only two main parts:
- 1 table access for fetching the
ProductGroups(in blue). This is exactly the same operation as in the first query, but there is a minor difference. The relativecostof this operation is 8% in the first query but 7% in the second. If this operation is considered to be cheaper, in relative terms, then the rest got more expensive! - 1 table access for fetching the first
Productby partitioning the data byGroupId(in red).
Having the Products and the ProductGroups, the database performs a LEFT OUTER JOIN before returning the result set to the client. Please note that the LEFT JOIN operation in the second query is a different one. This time it is a Merge Join instead of a Nested Loop Join, i.e. some databases have multiple approaches on how to perform a JOIN.
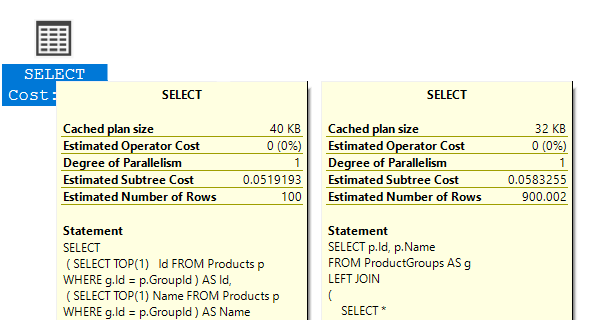
Evaluation of execution plans
Sometimes taking a glance at an execution plan is enough to spot a potential performance issue. There could potentially be multiple (unnecessary) JOINs with the same table or surprisingly high costs of an operation because the database performs a table scan, although we made an index for it.
When comparing two execution plans, the simplest way is to look at metrics or statistics provided by the database. In the case of MS SQL Server, such metrics are the estimated subtree cost, the correlation between the estimated and actual number of rows, number of reads, and so on.
Back to our examples. By hovering over the SELECT operator, we see that the cost of the first query is 0.051 and 0.058 of the second query. In other words, query one performs slightly better than query two. This is still true when comparing the estimated number or rows because both queries return 100 rows, so the estimation of query one is 100% correct, while the estimation of query two is obviously not.
Summary
Execution plans may appear cryptic or even daunting at first. After some time reading, it becomes natural. At first, you may start looking at metrics such as the estimated subtree cost and pretty soon you will want to know “Why?”…
If you have questions or need assistance, please feel free to contact me at pawel.gerr@thinktecture.com.